THE CHALLENGE
This year's challenge asked students to create an app focusing on a topic or issue related to Reducing Inequalities. This theme was based on one of the United Nation's 17 goals of sustainable development proposed in 2015. We chose to address housing inequality among vulnerable communities.
DESIGN
Though this challenge was GIS-based, I knew good design goes a long way. To incorporate my skills, I created a logo for HOMEwork with Adobe Illustrator in addition to supporting graphics.
.png)
.png)
GIS
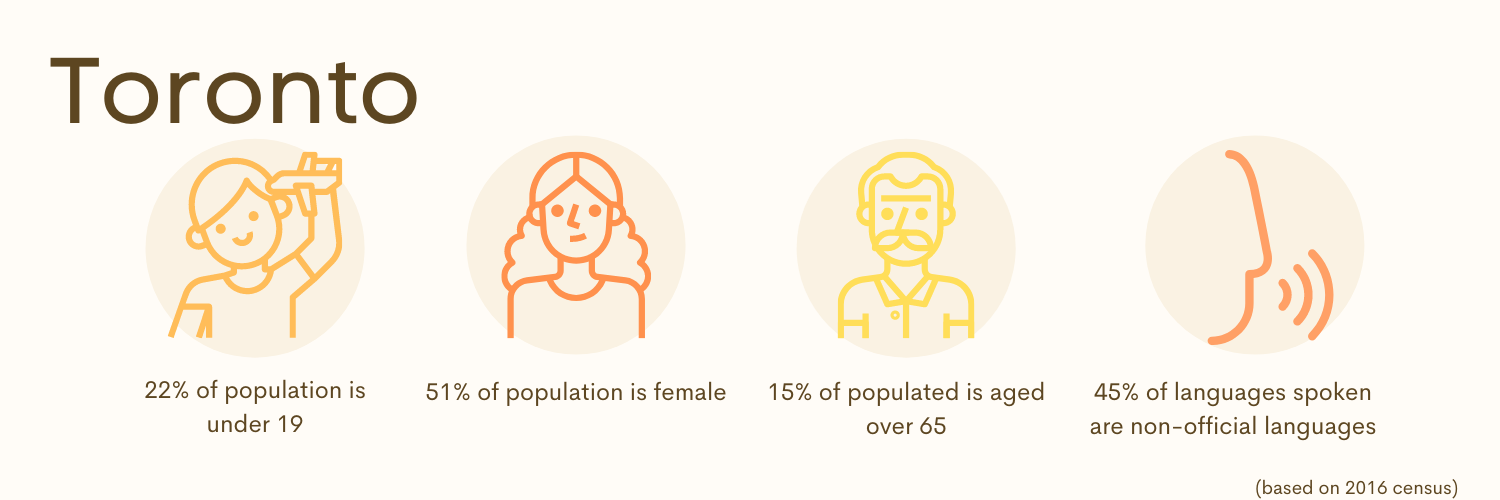
For the GIS portion of the app, I was tasked with displaying the ratio
of income to rent costs in the three most populous cities of Canada.
These cities are: Toronto, Montreal, and Vancouver.
I used historical census data in order to project rent costs and median
income until 2030. Collecting shapefiles of city boundaries, I was able
to use ArcMap to manipulate my data and display the ratios through a webmap
on ArcGIS online.


